The Ultimate Cryptocurrency Trading Guide

In the past year, the whole cryptocurrency market has surprised more than just a few.
During the bear marketing of 2018, many people started exploring alternative ways to profit from cryptocurrencies.
One of these methods and the one we will be talking about in this article is cryptocurrency trading.
Many amateur (and even experienced) traders find themselves making bad calls, due to not properly understanding how to predict the market conditions.
For that reason we decided to talk with experts and perform individual research, to help all beginners better understand the dynamics of crypto trading.
The results of our efforts have been compiled into this ULTIMATE trading guide.
How to trade cryptocurrencies
I fear not the man who has practiced 10,000 kicks once, but I fear the man who has practiced one kick 10,000 times. –Bruce Lee
When you decide to learn how to trade cryptocurrencies, it is essential to remember to build your skills from the ground up.
Most successful traders are not the ones that know everything, but those that have mastered the basics and know how to use them in order to create a profitable trading strategy.
Hence, here are the basic skills you need to master to start making profitable trades.
1. Understanding the Economic factors
In order to better understand what drives the cryptocurrency prices, we first need to learn some basic cryptocurrency economics.
If you are familiar with investment markets, you will probably know some of these concepts. Others, however, are unique to the cryptocurrency markets.
The basic factors that affect the price movements of a cryptocurrency are the following:
- Supply & Demand
- Utility
- Market Sentiment
- Mining Difficulty
1.1. Supply & Demand
Supply and demand play a huge role when it comes to price action.
Historically speaking, Bitcoin has a higher level of demand than most cryptocurrencies due to its reputability. With a total supply of 21 million coins, the number of coins available is very limited.
These low supply levels, combined with the overwhelming demand of 2017, helped Bitcoin reach its new all-time high at $19750.
1.2. Utility
Utility stands for the usefulness of a cryptocurrency. Coins or tokens with proven utility are often considered more valuable, which increases their demand.
Ethereum is a great example. It provides a platform where people can build decentralized applications, much like an “app store” but run on blockchain technology.
This utility of Ethereum has acted as a catalyst to mainstream adoption of cryptocurrencies, making it the second most valuable cryptocurrency.
1.3. Market Sentiment
When you decide to become a cryptocurrency trader, you will likely buy and sell your coins more often than long term “hodlers”.
In order to benefit from small price fluctuations through a high trading frequency, you will need to perform lots of research, hoping to find coins with positive market sentiment.
Thus, explore high-quality resources, including videos, blog posts and expert opinions on the cryptocurrencies you plan to trade. A great resource to predict a coin’s market sentiment is Coinmarketcal. 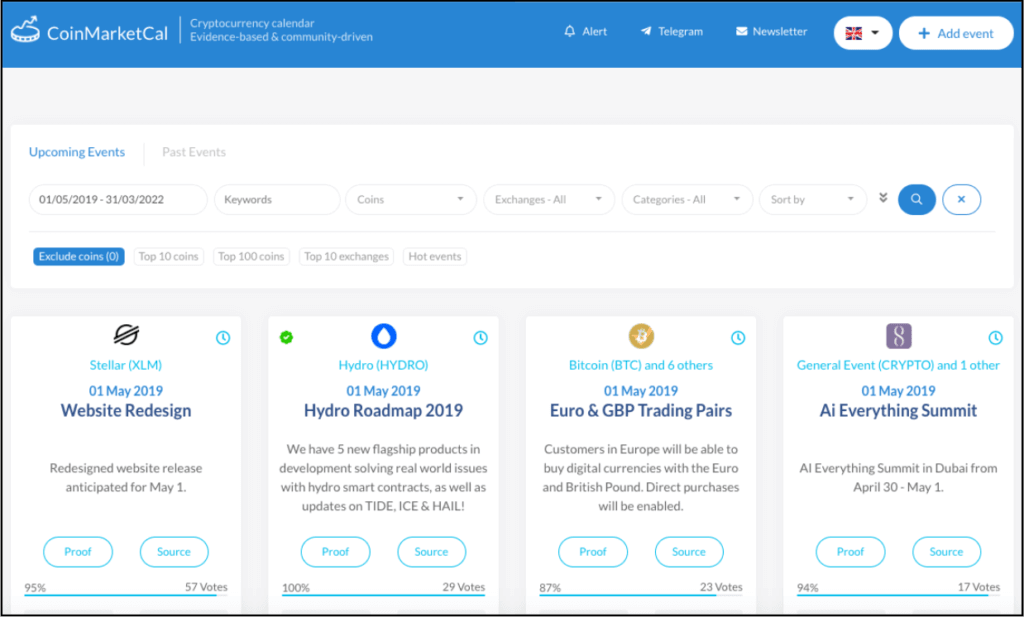
If your favorite coin is not on Coinmarketcal, you are better off not trading it. This is because in most cases, an increase in value is based on hype, marketing, and storytelling.
On top of that, the coin’s trading volume more often than not is quite low for you to be able to trade it efficiently.
1.4. Mining Difficulty
Mining difficulty represents the amount of effort needed to add a block to the blockchain. What you really want to know here, in regards to mining and supply, is:
- How many units enter the market per block
- The target wait time per block
- How much that new supply is of the total amount of coins.
This way, you will be able to calculate a cryptocurrency’s inflation. Some coins have a supply curve that decreases over time (halving), like Bitcoin, while others have a supply that increases over time.
In order to get a better idea about mining difficulty, it might be worth looking into the ‘supply curve’ of the cryptocurrency you are looking to trade.
Doing so will help you understand how many coins might be free to enter the market at any moment, and how many are locked for periods of time.
You can easily see how mining difficulty played a role in a coin’s price increase by reading about the history of Bitcoin.
2. Order Book & Stop Loss
Now that we understand the significance of economic factors, we will look at one more essential aspect of cryptocurrency trading – the order book and stop loss.
2.1. Order Book
The order book can show you all the buy and sell orders that have been placed at different price levels.
You can access the order book through most exchanges, where you can see it getting updated in real-time to provide an indication of liquidity for a cryptocurrency.
Liquidity stands for the ability to buy and sell a coin without affecting its price. The higher the trading volume, the higher the liquidity. 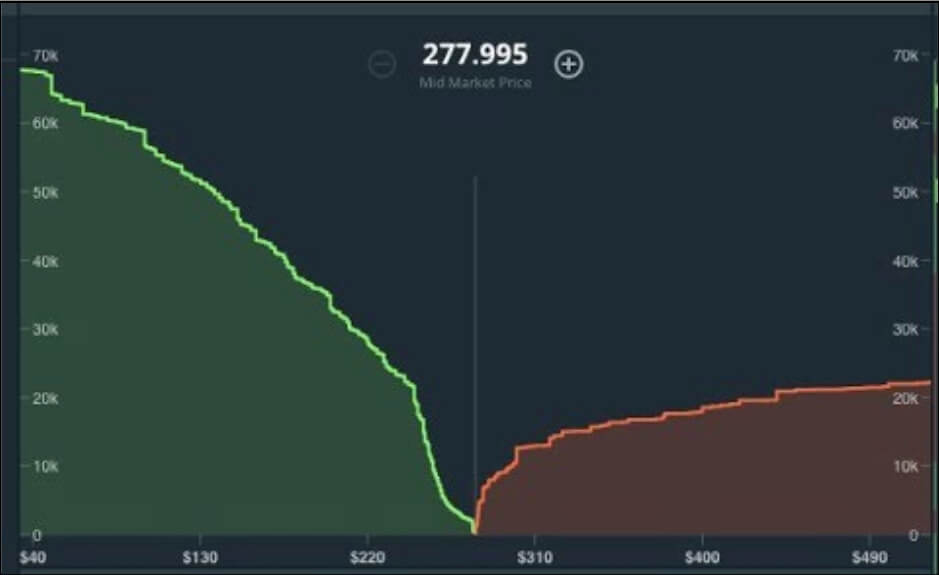
The amount on the horizontal axis is the price a market participant is willing to exchange a particular cryptocurrency for, while the vertical represents the number of open orders for each price point.
EXAMPLE
If person X created an order to sell one Bitcoin for $6000, this would be perceived as a market order and take place in the order book. Person X’s trade would remain in the order book until it gets filled. If person X’s sell order was matched with person Y’s buy order for one Bitcoin at the price of $6000, the order would be filled.It is good to remember that, while an order book (liquidity indicator) is useful to get a sense of the market, traders are able to use it in order to manipulate the perception of other traders.
On top of that, the order book can also change rapidly in case of a sudden price move or media attention.
Therefore, traders tend to choose exchanges with higher coin liquidity so they don’t affect the price negatively by selling their coins.
Finally, cryptocurrencies with high liquidity are much harder to manipulate, making them bad targets for so-called “pump and dump” schemes, which are often seen in coins with a smaller market cap.
2.2. Stop Loss
Placing a Stop Loss sell order is probably the best thing you can do when it comes to capital preservation. This tool helps traders sell their holding in case of an unexpected turn in the market.
Essentially, if you place a sell order at a higher price but your coins keep dropping in value, a stop-loss order will limit your losses.
On the contrary, a Stop Loss buy order allows a trader to collect profits when his cryptocurrency reaches a specific price.
This method of selling helps traders avoid what is known as “emotional trading”, which stands for the attachment one feels for certain cryptocurrencies.
EXAMPLE
If John bought X coin at a price of $10, but he had a feeling that the price would drop below 10% of his initial buy-in price, he could add a stop loss sell order at a price of $9. So, if X coin hits this price, his holdings will be sold automatically.In this case, John’s sale order is beneficial and here is why. If the price would decrease from $10 to $9 the coin may break its support line which could be an indication that the price will keep dropping until it finds support on even lower prices.
This process is similar when employing a stop loss buy order, except the selling price has to be at a point above the initial buy-in price.
3. Technical analysis
Your ability to perform technical analysis will make or break your trade.
Every cryptocurrency trading blog seems to be very expressive about the need for all new traders to understand how this one works.
The term itself refers to several tools and methods that can be used to analyze and compare historical price data to make future price predictions of certain cryptocurrencies.
And while many crypto enthusiasts like to chant that “TA doesn’t work”, it has been proven time and time again that, in the crypto market, history tends to repeat itself.
As a result, TA has become a very effective method to predict short-term price fluctuations and make the best out of the current market situation. Let’s break down the basics.
3.1. Relative Strength Index (RSI)
The RSI is a momentum oscillator that calculates the speed and strength of price movement, whether bullish or bearish, by comparing it to past price performance.
This tool can also compare historical data in order to estimate whether a cryptocurrency is overbought or oversold.
The RSI oscillates between 0 and 100 depending on how overbought or oversold a cryptocurrency is, compared to its past price movements.
Oversold – When the RSI is approaching or even crossing the ±30 level, there is a positive market reversal, signaling an expected value increase.
Overbought – When the RSI is approaching or crossing the ±70 level, traders tend to sell their holdings expecting a pullback in price, which is usually followed by a negative market reversal. Here is an example: 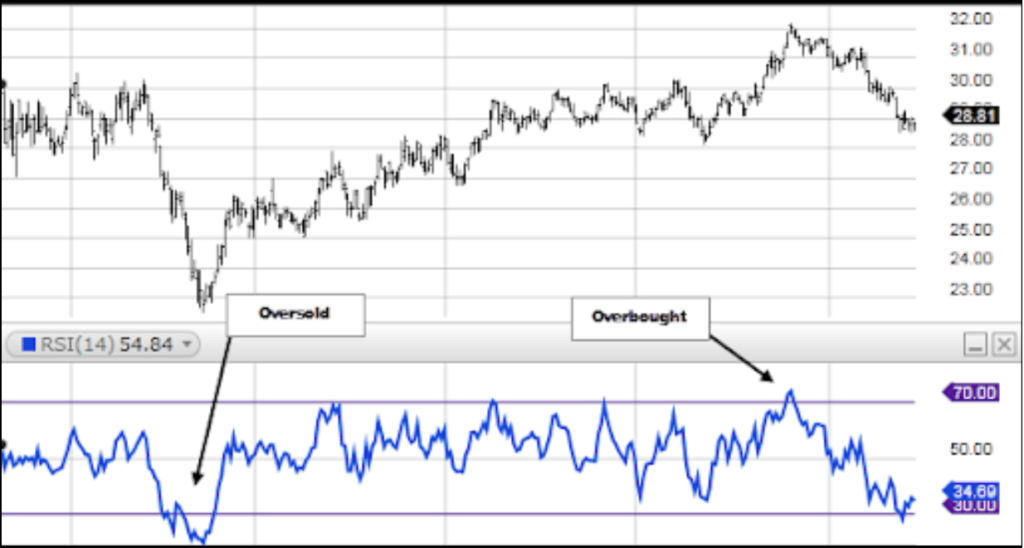
3.2. The Moving Average Convergence/Divergence (MACD) Indicator
The MACD is an indicator that is used to identify bullish or bearish market trends.
The indicator consists of two, exponential moving averages (MACD line and Signal line) that measure the momentum of a cryptocurrency based on past price action.
The tool also features a histogram (red and green vertical bars), which shows the divergence between the two lines.
These two lines, which are known as moving averages, as well as the distance between them, is known as the MACD (moving average convergence/divergence).
Let’s take a look at how the tool works: 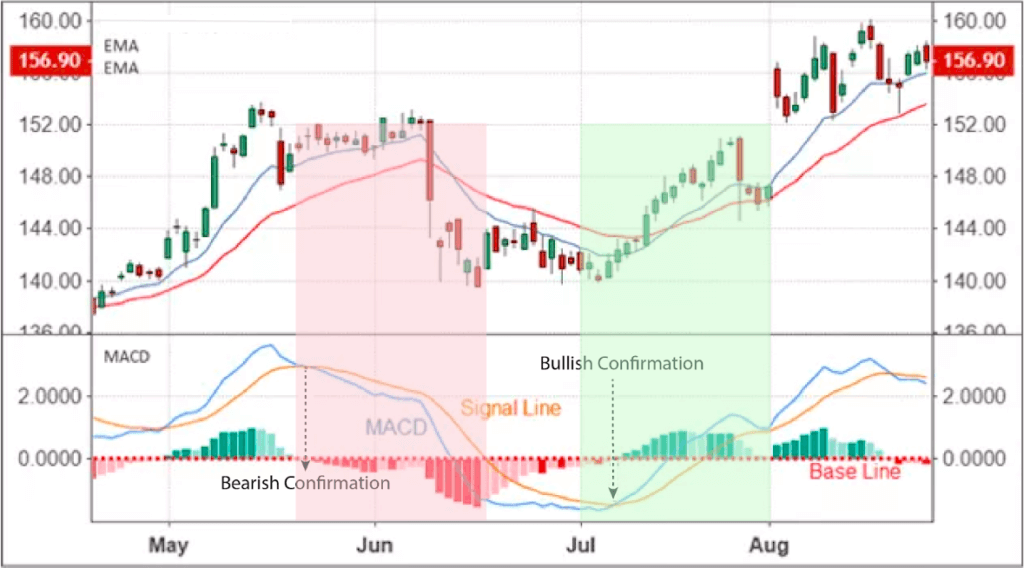
- Positive divergence – When the two lines (MACD & Signal) move closer to each other, and the bars in the histogram become green, the tool indicates that it is a good time to buy.
- Negative divergence – When the two lines move away from each other, the bars turn red, which indicates a sell signal.
Look for crossovers – when the MACD line crosses above the signal line, that’s a bullish indicator.
On the other hand, when the MACD crosses below the signal line you will see a bearish indicator.
3.3. Bollinger Bands
With Bollinger bands and a bit of practice in your trading tool-kit, you are no beginner anymore.
So, here’s what they are and how you can use them.
The Bollinger bands are three lines (bands) that can be found in and around the price chart of a cryptocurrency. They consist of a moving average (the middle band), an upper, and a lower band.
Their role is to predict whether the price of a coin is high or low, on a relative basis. When a cryptocurrency experiences volatile price action, the Bollinger Bands diverge from each other.
While, on more stable periods, the bands come closer to the average, creating a contraction. Thinner bands may indicate that a coin market may soon experience volatility.
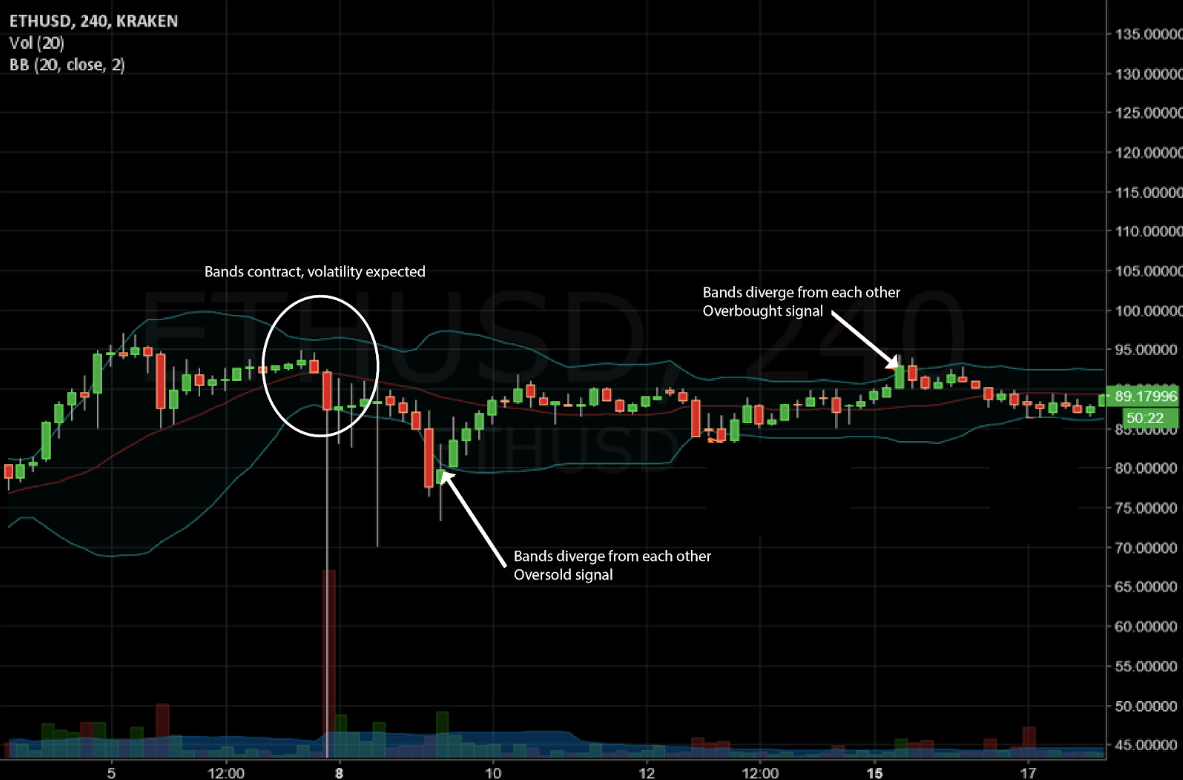
- When the bands contract, we can expect volatility in the price
- As soon as the price comes close to the upper Bollinger band, we get an overbought signal.
- As soon as the price comes close to the lower Bollinger band, we get an oversold signal.
So far so good, huh? Before you start buying and selling cryptocurrencies, there is one more thing to learn about.
3.4 Candlestick patterns
Candlesticks are also seen as key indicators when performing technical analysis.
The best way to understand trend lines is to measure historical data in longer timeframes. And in order to make these trend lines more accurate, you might want to learn how to use candlestick graphs.
Candlestick patterns are used to create lines that can predict price movement.
For more accurate predictions, traders tend to cross-check their patterns with the general market sentiment, volume, and other TA tools, to predict future market performance.
Bellow, we will give a short description of the most common candlestick trading patterns.
You can, of course, explain each term in more detail by also reading upon other cryptocurrency guides that are focused on each method separately.
These patterns are used by the world’s best traders to identify common trends when performing TA. 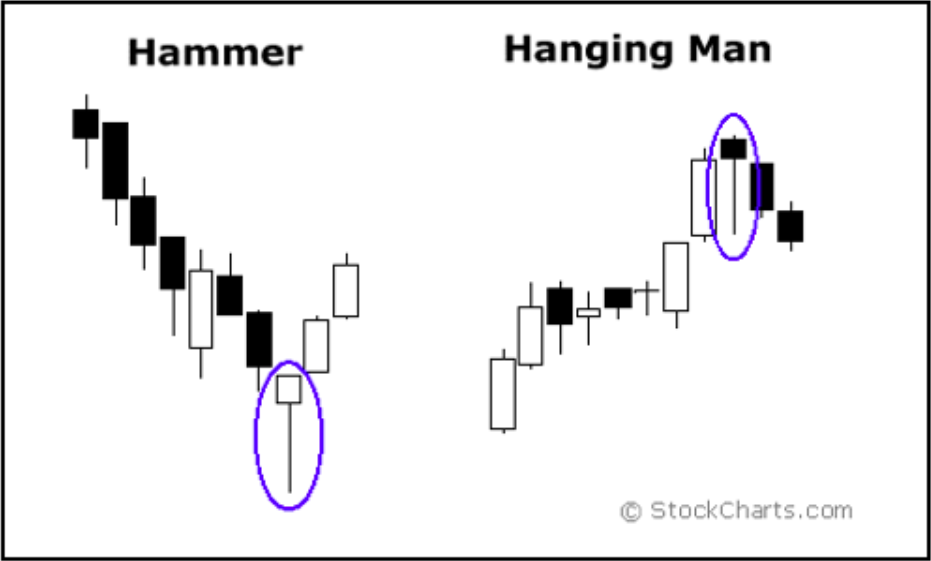
The Hanging Man signals the opposite of the Hammer. This is a bearish reversal pattern and signals that a coin is approaching the top of its uptrend.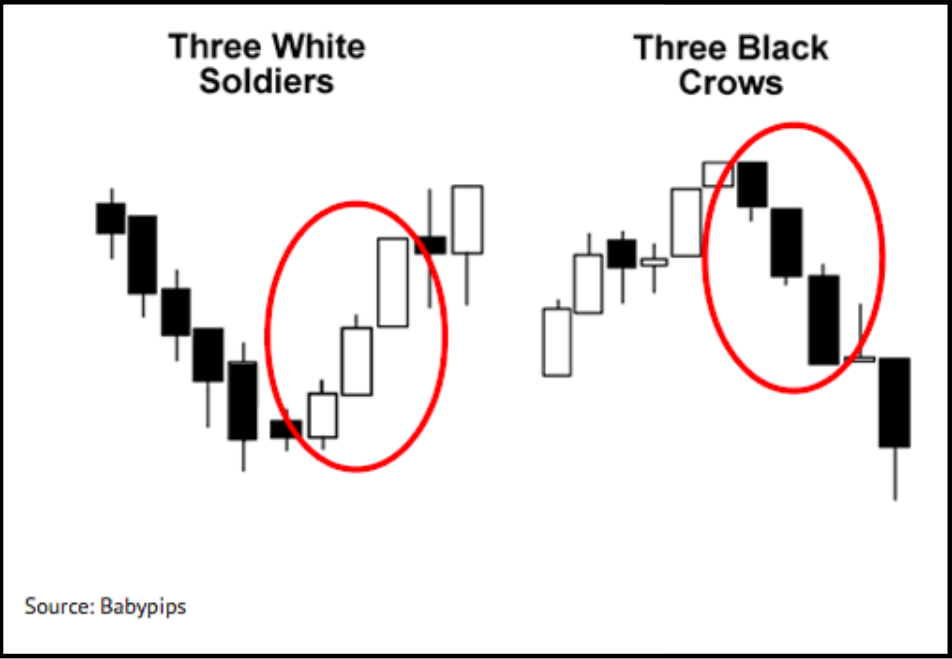
This pattern usually appears during a time of price consolidation and can help traders “take their profits” at the right time.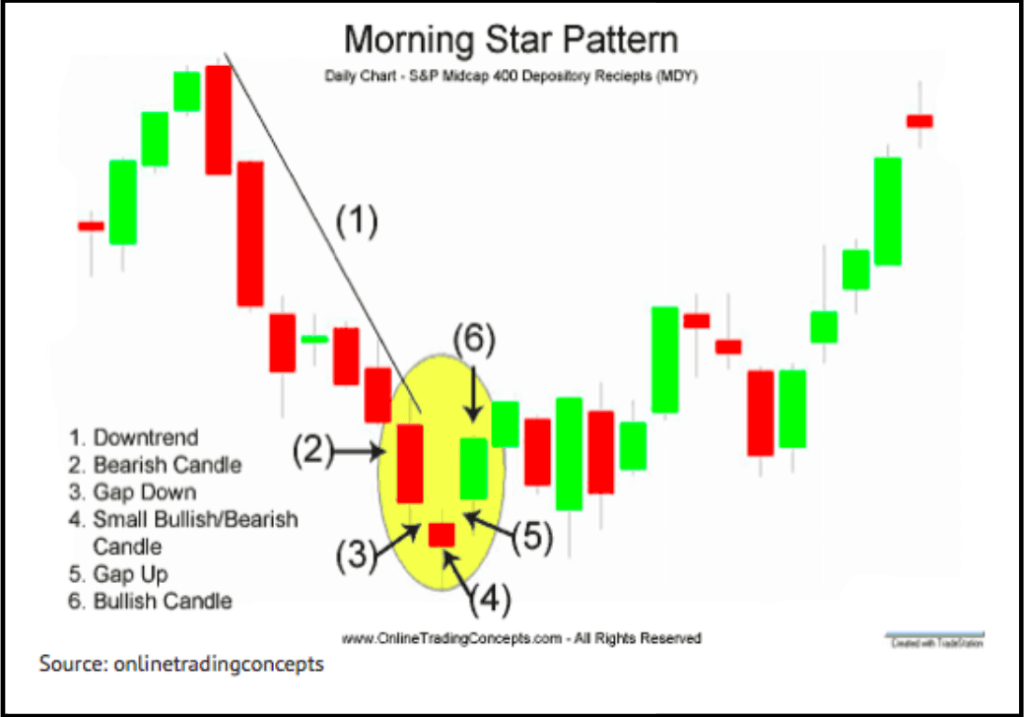
This is a popular pattern that traders look for when prices are in a downtrend since it signals a positive price reversal. So, here you go! These ones should help you start your trading journey.
4. Practical advice
If you have read this far, you should have a basic understanding of the concepts and tools traders use to predict price fluctuations.
Now it’s time to put all that in practice.
This chapter will help you practice your newly acquired skills by analyzing where and when to trade.
4.1. Exchanges
In order to start trading, you will need to find a digital platform where cryptocurrencies are exchanged between members.
For traders, several options work better than others, due to their features. A common feature that is often preferred, is an exchange that trades directly between Fiat and Crypto, such as Paybis.
These “fiat gateways” are great for beginners, especially those who are looking to inject some starting capital for trading.
For now, we recommend you start using one exchange for all your trading, even if the coin selection is relatively limited compared to others.
This practice will not only help you develop your trading skills, it will also save you the withdrawal fees of sending your coins between exchanges.
4.2 Arbitrage trading
Once you become accustomed to trading, you may hear the term “arbitrage” being mentioned quite often.
This practice describes the simultaneous purchase and sale of a certain cryptocurrency between exchanges to profit from a price imbalance.
Essentially, the process goes as follows:
Exchange 1 sells X cryptocurrency for $10 per coin Exchange 2 sells X cryptocurrency for $12 per coin
1st step: Buy X cryptocurrency for $10 on exchange 1
2st step: Transfer X cryptocurrency from exchange 1 to exchange 2
3st step: Sell X cryptocurrency on exchange 2 for $12
4st step: Trader has made a profit of $2
While many traders see this an easy way to make money, you should always consider the risks of this trading method.
For once, while performing an arbitrage trade, the exchange rates can change in a matter of seconds, resulting in an unsuccessful trade.
You can minimize your risks by doing the following:
- Have fiat money available on both platforms you are looking to trade on
- Check the liquidity on each exchange to know how many buy and sell orders are available on each price point.
Other risks may involve small available volumes for the price you are interested in, high transaction fees or execution delays.
4.3 Social Media
We often see that a celebrity endorsement or industry news can have a strong impact on the price of a certain coin.
Grab this opportunity and use the power of Social media to your advantage, by staying involved with industry news at all times.
A tweet from an influential personality can have a major impact on a coin’s price. A great example of celebrity endorsement was seen with Verge (XVG), when John Mcafee, a controversial figure in the crypto space, simply mentioned it in a tweet
I am inundated by people asking me for recommendations on cryptocurrencies. If you would use your heads you would figure out that the privacy coins (anonymous transactions) will have the greatest future. Coins like Monero (XMR), Verge (XVG), or Zcash (ZEC) cannot lose.
— John McAfee (@officialmcafee) December 13, 2017
The result?
A tenfold appreciation in price in just over two weeks’ time.
Reddit has always been a great way to perform research on any given subject.
Cryptocurrency subreddits will often present less known news about your favorite coins before anyone else does.
What we love about Reddit is that you can follow only the subreddits you are interested in. For example, if you only want to know Bitcoin news, you can follow the subreddits: /r/Bitcoin or /r/btc.
Keep in mind that forums are open to anyone. This means that there will often be misleading or inaccurate information on the boards, leaving it up to you to decide whether you should act upon the latest news or not.
While not really a Social Media platform, Telegram has made an instrumental role on the way coin teams communicate with their fans. Therefore it might be worth utilizing this channel as well.
Tips from The Top Traders
Now that you got a basic understanding of trading, chances are that you can predict price fluctuations and trade accordingly.
And while that’s great news, you also need a lot of experience to become a successful trader.
For that reason, we asked for a piece of advice from traders that have spent years trading cryptocurrencies – so they can give you some great tips as well.
To do this, we reached out to popular cryptocurrency forums and Facebook groups asking one simple question:
“What are the top 3 tools or resources that all traders should learn how to use?”
As a result, there were 37 traders to share their insights and the best of the answers you can find down below:
Haunebu
In my opinion, these resources go a long way in helping a trader become successful. They have helped me a lot though I am a HODLER primarily.
– Stop-loss indicators
– Trading View and similar resources
– Pattern analysis
Mahanton
The most common tools that traders should learn how to use:
- Technical analysis (Indicators) Common thing of all but really worth to test on.
- Stop Loss management (Risk handling)
- Media outlet (Part of Fundamentals where it’s critical to make considerations of these things).
kryptqnick
Even though Coinmarketcap is rather popular, it might qualify as underutilized. People usually focus on marketcap and price charts, but this website can help with more than that. For instance, there is trading volume, and its dynamics can also help to predict the price movements (when it increases significantly, get ready for a bull run, whereas if it keeps going down, be cautious).
The website also has historical snapshots that help to get a bigger picture of how the market has been changing over time.
Another useful thing for potential small profits is that one can click on a chosen coin and take a look at different markets with trading pairs and prices. One can try to play on the difference between the prices on different exchanges.
Chris Bellizia
- Candlestick patterns
- Support/Resistance levels
- Fibonacci retracement
Andreas Pielmeier
Start to study the RSI first (oversold, overbought, divergences), add the MACD to your study-list & you should definitely check the Fibonacci retracement. Well, there are TONS of indicators so try to start with the basic ones. Good luck.
Seti Tanuvasa
Note: We chose to add this answer since we believe that Emotional Intelligence(3) is one of the most important factors for successful trading.
1. I can’t stress enough how important support and resistance is. Even in the oscillators you decide to use.
2. Choose a strategy and work it hard, stick to it no excuses!
3. Kill your emotions or your emotions will kill your money! Emotion is a money killer!
Slimline Simon
You don’t need to be an indicator junkie following a load of lagging signals to trade:
1. The RSI and MACd are good for spotting divergence.
2. Market structure, you will know when to enter and exit the market!!!!
3. Fibonaccis are crucial, square ups are also crucial to understand.
Summary of Trading Tips
After we collected and cross-checked all the answers, we chose the top 3 answers for each category:
- The Top-3 tools every trader should learn how to use
- The Top-3 resources everyone interested in trading must use
And the best answers to help you become a better trader can be found below.
Top-3 Trading Tools
Here is what traders had to say about the best tools that all traders should learn how to use: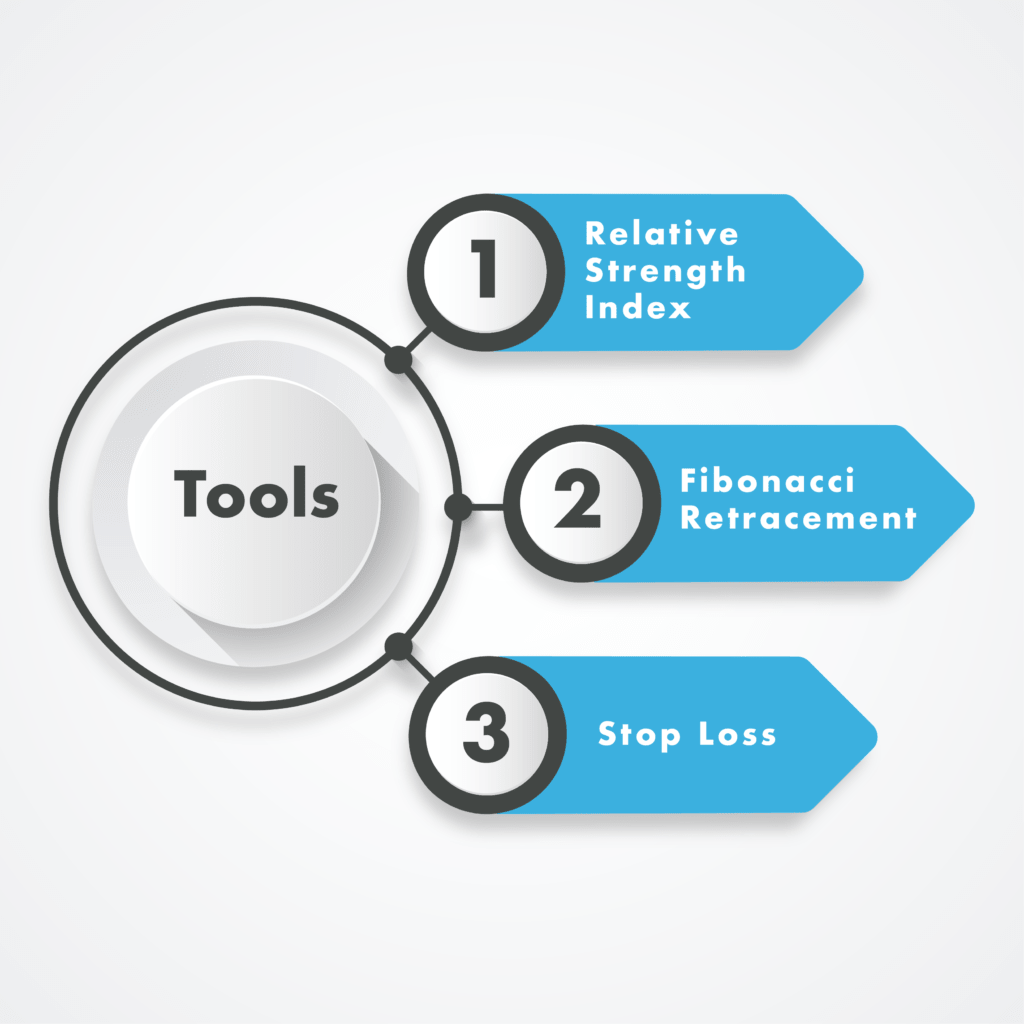
In order to get a better understanding of these tools, we did the heavy lifting and found the most useful guides on each topic:
- To learn more about the Relative Strength Index (RSI) read chapter 3.1 above
- A great guide on Fibonacci retracement can be found here
- As for Stop Loss, you can read chapter 2.2 above
You can combine these tools with the most recommended resources, as shown below.
Top-3 Trading Resources
The top traders were really specific on which resources they suggest to use. Here are the best, underutilized resources they recommended:
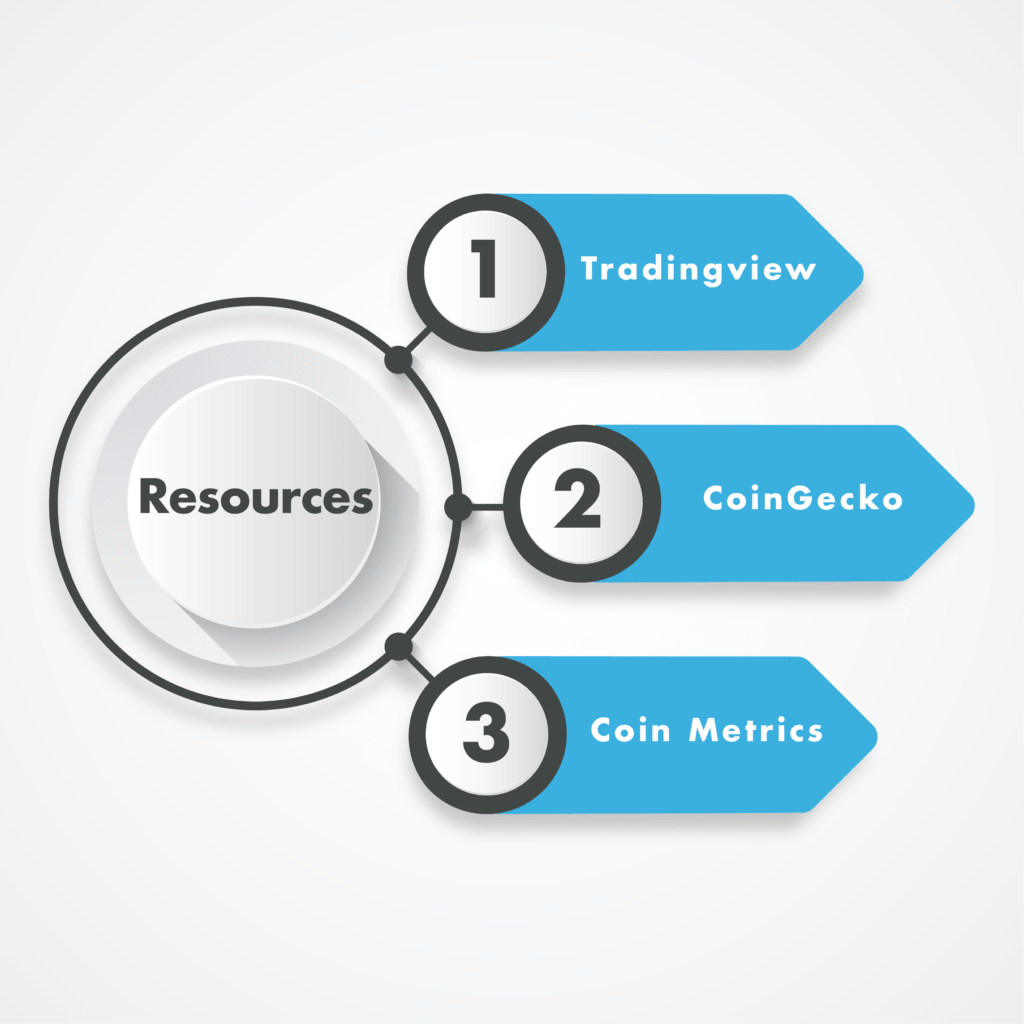
- TradingView– This resource is great for beginners who are looking to trade without involving real money and risk. After experience is built on TradingView, the same traders can choose to start trading on cryptocurrency exchanges.
- CoinGecko– Some of the traders we reached out to claimed that Coinmarketcap, a resource used by most traders to analyze historical data of cryptocurrencies, includes fake volumes in their price estimations. As a result, and to get a more realistic idea of a coin’s price, they recommend using CoinGecko.
- Coin Metrics– This website collects and shares important information, creating data and charts (both downloadable) which provide useful information for new investors. The data includes: Transaction Count, On-Chain transaction volume as well as a coin’s price, marketcap, and liquidity.
Now it’s your turn!
Learning how to trade cryptocurrencies can be as exciting as it can be risky.
And while knowledge and emotional intelligence can help you take advantage of the volatile price movements, impatience and overconfidence can turn things sideways just as fast.
So, to quickly summarize, here’s what you learned:
- The economic factors that affect Bitcoin’s price
- How to read the order book
- Different ways to use stop-loss
- How to perform technical analysis
- How to use all of the above in practice
- A collection of the best-underutilized tools and resources, as seen by expert traders.
Finally, always strive to learn more by exploring different reputable sources and never risk more than you can afford to lose.
We hope you enjoyed this guide. Let us know about your trading journey by leaving a comment below.
As always, if you are ready to start trading, you can buy some Bitcoins using Paybis.
Disclaimer: Don’t invest unless you’re prepared to lose all the money you invest. This is a high‑risk investment and you should not expect to be protected if something goes wrong. Take 2 mins to learn more at: https://go.payb.is/FCA-Info